R1: Oxygen Photolysis
O2 + hv -> O + OMolecular oxygen absorbs short-wavelength ultraviolet radiation and breaks into two oxygen atoms. This reaction supplies the atomic oxygen needed to start ozone formation.
PROFILE NODE
Using ozone photolysis in the Chapman cycle to understand cross sections, photolysis rates, and PATMO settings.
Student Handout
Lecture 2 used the Chapman cycle to introduce a reaction network. The same cycle contains two photochemical reactions:
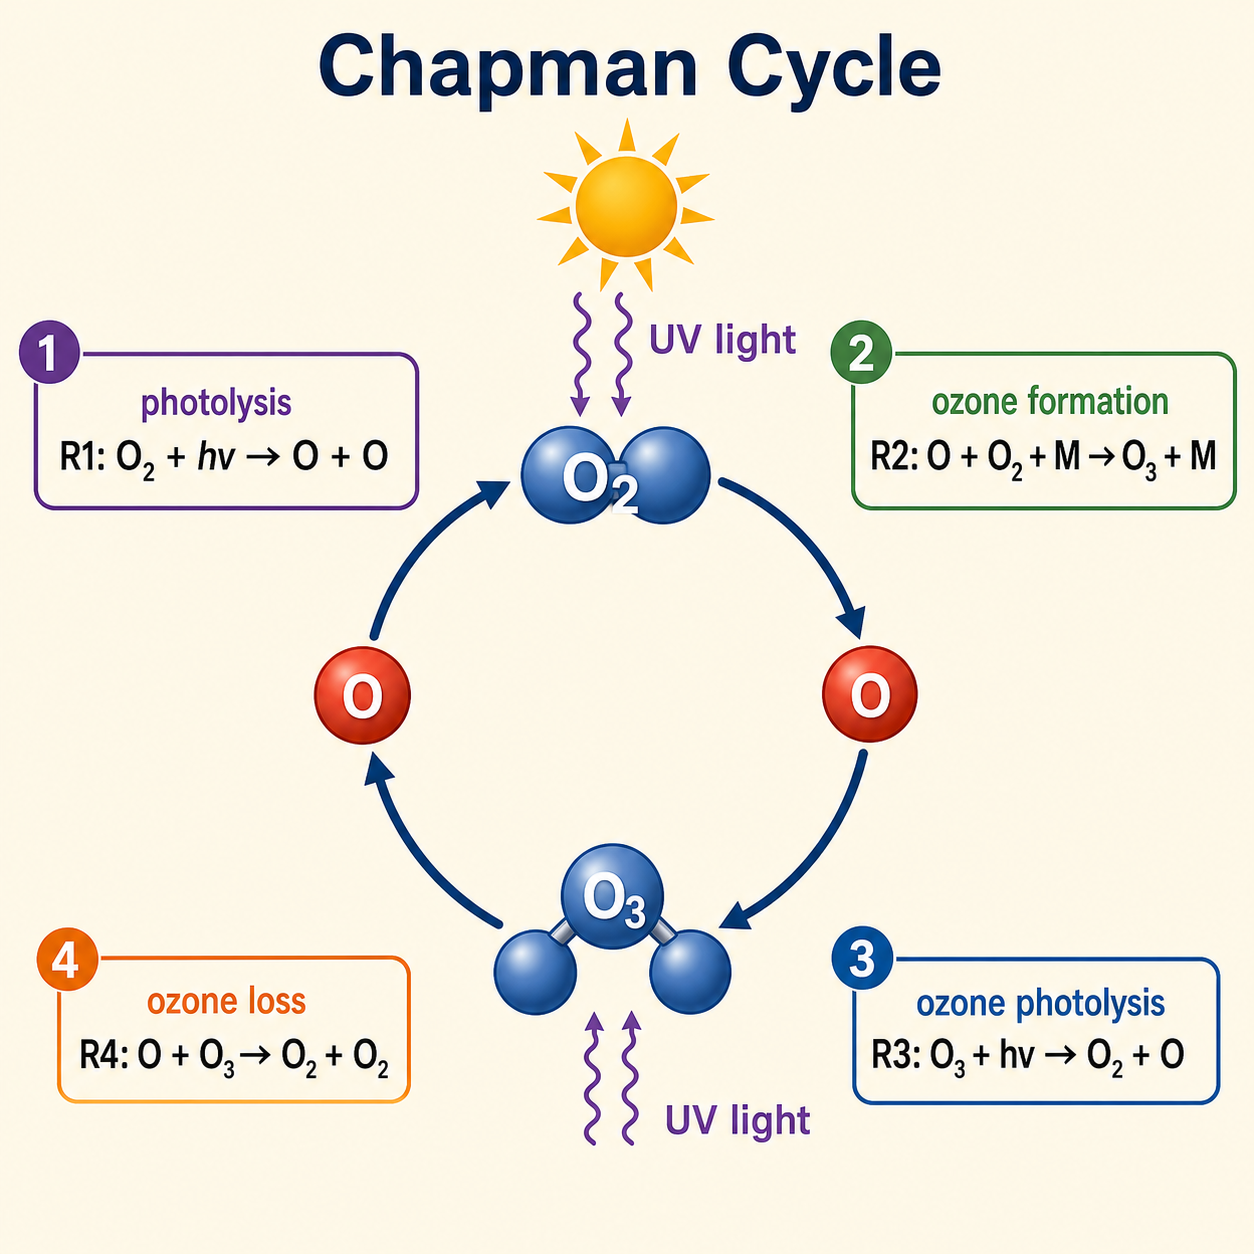
R1: O2 + hv -> O + O
R3: O3 + hv -> O2 + O
In this lecture, we will use O3 + hv -> O2 + O as the worked example.
This reaction shows why photochemistry is different from ordinary thermal kinetics:
instead of finding one thermal rate constant k(T), we need to understand how a photolysis rate
J is calculated from radiation, absorption cross section, and quantum yield.
R1: Oxygen Photolysis
O2 + hv -> O + OMolecular oxygen absorbs short-wavelength ultraviolet radiation and breaks into two oxygen atoms. This reaction supplies the atomic oxygen needed to start ozone formation.
R3: Ozone Photolysis
O3 + hv -> O2 + O
Ozone absorbs a photon and dissociates into molecular oxygen and atomic oxygen.
In a more detailed mechanism, product channels such as O(3P) and O(1D)
should be treated separately.
Worked Example In This Lecture
We focus on O3 + hv -> O2 + O because ozone has widely used UV/VIS absorption data,
and it gives a clean example for learning how to search cross-section databases.
Why This Is Not A Normal k
Photolysis depends on the radiation field. The same molecule can photolyze quickly or slowly depending on wavelength, altitude, solar zenith angle, shielding, cross section, and quantum yield.
Main Point
For photochemical reactions, the model calculates a photolysis rate J.
The database usually gives cross sections and quantum yields, not a single universal J.
For this lecture, use one photolysis-rate equation:
Photolysis Rate
\[ J_{i,z} = \int_{\lambda_1}^{\lambda_2} \phi_{\lambda}(\lambda) \sigma_{\lambda}(\lambda) I_{\lambda}(z) \, d\lambda \]
Here I is the solar irradiance reaching altitude z.
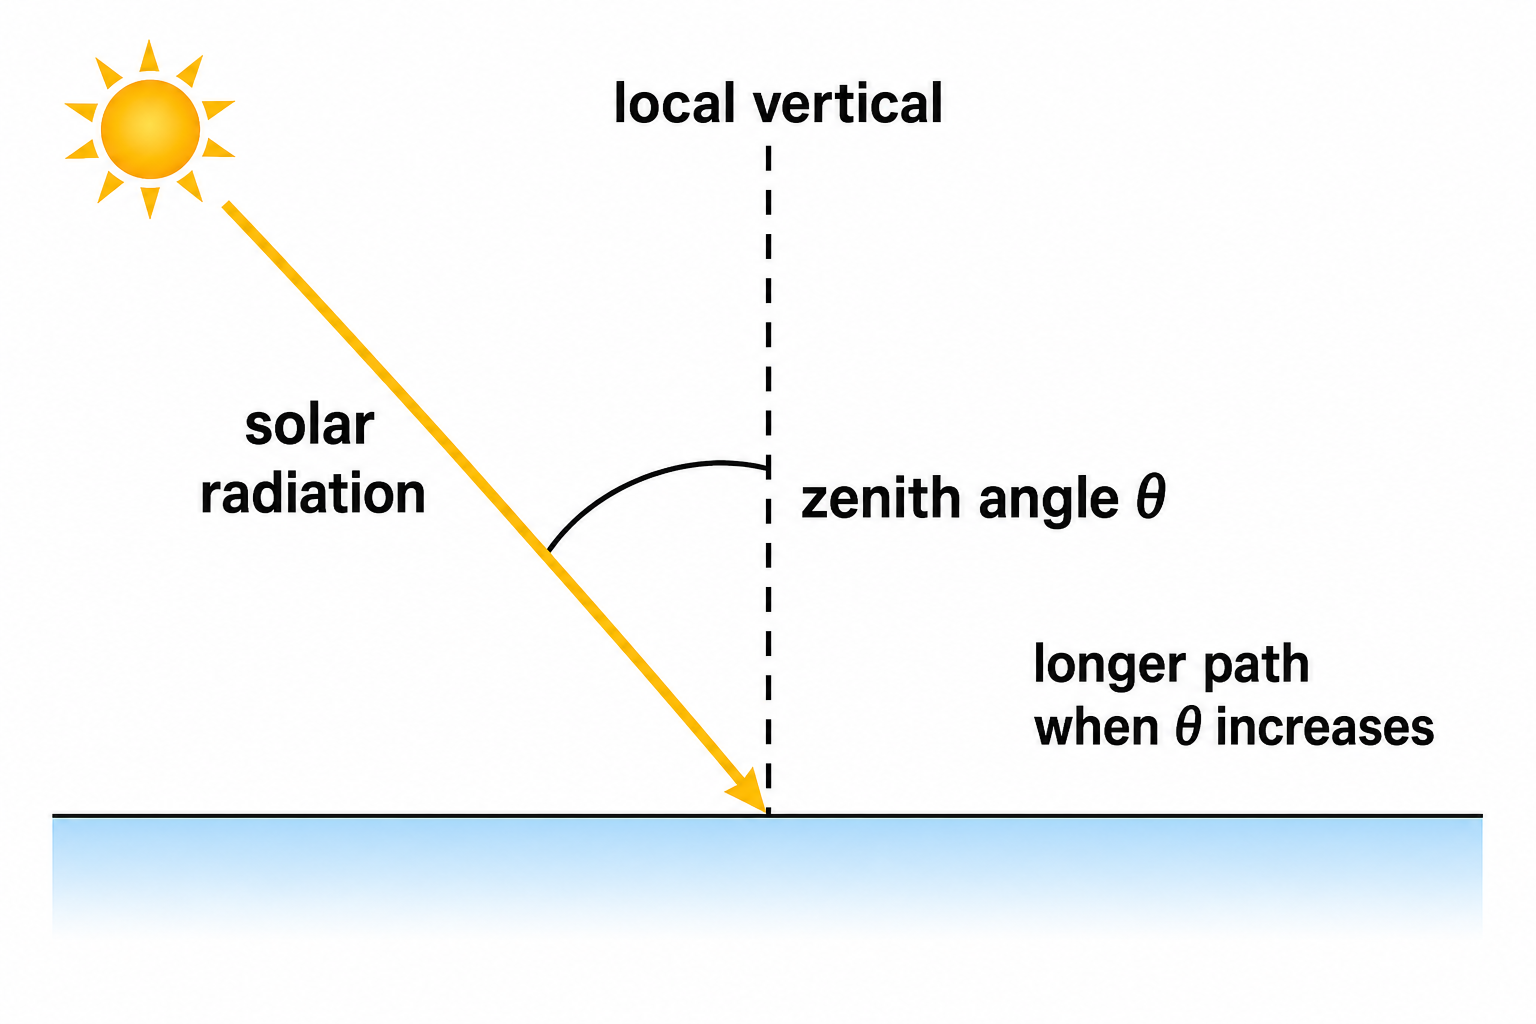
In a simple attenuation form, it can be connected to optical depth and solar zenith angle:
Irradiance With Optical Depth
\[ I_{\lambda}(z) = I_{\lambda,0} \exp\left[-\frac{\tau_{\lambda}(z)}{\cos\theta}\right] \]
\(J_{i,z}\) is the photolysis rate of reaction \(i\) at altitude \(z\). Its unit is \(\mathrm{s^{-1}}\). For ozone photolysis, this is the \(J(\mathrm{O_3})\) value used in the reaction network.
\(\phi_{\lambda}(\lambda)\) is the quantum yield for the selected product channel. It is the probability that photon absorption produces the products written in the photochemical reaction.
\(\sigma_{\lambda}(\lambda)\) is the absorption cross section at wavelength \(\lambda\). It tells us how strongly the molecule absorbs light. It is commonly reported in \(\mathrm{cm^2\,molecule^{-1}}\).
\(I_{\lambda}(z)\) is the solar irradiance at wavelength \(\lambda\) and altitude \(z\). It is reduced from the top-of-atmosphere irradiance \(I_{\lambda,0}\) by atmospheric optical depth.
\(\lambda_1\) and \(\lambda_2\) define the wavelength range of the photolysis calculation. The term \(d\lambda\) means the integral is evaluated over wavelength.
\(\tau_{\lambda}(z)\) is the vertical optical depth above altitude \(z\). Larger optical depth means stronger attenuation before radiation reaches the layer.
\(\theta\) is the solar zenith angle measured from the local vertical. The factor \(\cos\theta\) converts vertical optical depth into an approximate slant-path optical depth: \(\tau_{\mathrm{slant}} = \tau / \cos\theta\).
The MPI-Mainz UV/VIS Spectral Atlas cross-section page is a common entry point for gas-phase atmospheric absorption cross sections. The atlas also provides quantum-yield data through a separate section.
Step 1: Open Cross Sections
Go to the MPI-Mainz cross-section page. You can browse by molecular category or use the species search.
Step 2: Search Ozone
For this lecture, search for O3 or open the Ozone category.
The ozone page lists many measurements with different wavelength ranges and temperatures.
Step 3: Choose A Data Set
Choose a data set that matches the model wavelength range and temperature as closely as possible. Record author, year, temperature, wavelength coverage, and file name.
Step 4: Download And Inspect
Numerical files are ASCII text files. The first column is wavelength in nm,
and the second column is cross section in cm2 molecule-1 or quantum yield when using the quantum-yield section.
For O3 + hv -> O2 + O, students should connect the database data to the model setup in this order:
choose photolysis reaction
find O3 cross-section data
find or confirm quantum yield data
	check radiation, optical depth, zenith angle, and wavelength settings
point PATMO to the correct input files
run and inspect J(O3) output
Do Not Skip This Check
A correct reaction equation is not enough. For photochemistry, the reaction network, cross-section data, quantum-yield data, wavelength grid, and radiation settings must be consistent with each other.
Complete a short photochemistry setup note for the Chapman reaction
O3 + hv -> O2 + O.
O3 absorption cross-section data set in MPI-Mainz.